Menu
Finding Databases That Have Not Been Accessed (And An Adventure with ChatGPT)
By Jeff Horner | Expert
By Jeff Horner | Expert
I have a client that has thousands of databases. They asked for a script that would tell them which databases had not been accessed in the last 90 days.
I thought this would be an easy ask because we could just look at the index usage stats DMV and see which databases had no seeks, scans, or updates. I also asked Google AI what it thought and it came back with the same answer.
I tested my theory on their server using the script I wrote…. And I was shocked to see that every single database showed read/write access within the last 90 days! I was surprised because I knew they had moved over 500 databases to a new server. Those databases should’ve had no access on the old server.
As an exercise, I asked ChatGPT what it would recommend. It came back with a script that queried sys.dm_exec_sessions. I knew that wouldn’t work, so I asked it to rewrite without sys.dm_exec_sessions because it would not work for a 90 day period. I pointed that out to the engine and it agreed. It gave me a new query which I then tested and found lacking because it used an invalid parameter with one of the DMV’s.
I tried again and asked for a different query that didn’t use the bad DMV. It happily gave me a new one which I then executed and found I had the same problem with a different DMV!
I got a little frustrated and let my co-workers know what was going on. Jeff Schwartz (who I will refer to as Coach now) has had extensive experience with ChatGPT and has learned how to converse more eloquently with the engine. (I may have insulted it once or twice!)
Coach went through a similar experiment and ran into some of the same issues. He also started out with sys.dm_db_index_usage_stats, but I told him that the activity that I was seeing on every database. He also moved through multiple scripts and ideas, sometimes getting close but still coming up short.
Finally, he asked it to go back to the beginning and start over with index usage stats to see if there was another method that would solve this problem.
I won’t go through the entire conversation he had with ChatGPT (for the sake of brevity), but here is a summary of the process it suggested:
This approach focuses on the sys.dm_db_index_usage_stats DMV, capturing snapshots over time to distinguish system (maintenance) usage from user (actual reads/writes). One of my thoughts was that each database was being backed up each night and that there was a job that was working on index maintenance.
Step 1: Understand the DMV (sys.dm_db_index_usage_stats)
• What It Tracks: For every index in every database, it shows how many times that index was:
– Sought: user_seeks vs. system_seeks
– Scanned: user_scans vs. system_scans
– Looked up: user_lookups vs. system_lookups
– Updated: user_updates vs. system_updates
• User counters (user_seeks, user_scans, etc.) increment when non-system T-SQL statements run (i.e., typical end-user or application queries).
• System counters (system_seeks, system_scans, etc.) increment when SQL Server internal tasks or scheduled maintenance operations (backups, DBCC, index rebuilds) touch those indexes.
Key Insight: If a database’s indexes only ever increment the system_ counters—and the user_ counters remain 0—then it is highly likely that no real user/application queries are hitting that database.
Important Caveats to remember: sys.dm_db_index_usage_stats resets upon:
1. SQL Server restarts
2. Certain operations that rebuild metadata
3. Potentially under rare memory pressure conditions
Therefore, a single, point-in-time lookup might be misleading. The standard practice is to capture these stats at intervals (e.g., daily) and store them in a custom table so you have a cumulative history even if the server restarts.
Step 2: Create a Logging Table (IndexUsageStatsLog) in an administrative or DBA utility database (e.g., DBAdmin)
Create a table to store snapshots:
CREATE TABLE DBAdmin.dbo.IndexUsageStatsLog (
 LogID INT IDENTITY PRIMARY KEY,
CaptureDate DATETIME NOT NULL DEFAULT (GETDATE()),
DatabaseID INT,
DatabaseName SYSNAME,
UserSeeks BIGINT,
UserScans BIGINT,
UserLookups BIGINT,
UserUpdates BIGINT,
SystemSeeks BIGINT,
SystemScans BIGINT,
SystemLookups BIGINT,
SystemUpdates BIGINT);
Step 3: Schedule a Recurring Job to Insert Snapshots Use a SQL Agent job (nightly or weekly).
• This way, you will get a snapshot each day/week. If the SQL instance restarts, you begin capturing from zero again—but by storing these snapshots, you retain historical evidence of usage growth.
INSERT INTO DBAdmin.dbo.IndexUsageStatsLog (DatabaseID, DatabaseName, UserSeeks, UserScans, UserLookups, UserUpdates, SystemSeeks, SystemScans, SystemLookups, SystemUpdates)
SELECT
d.database_id,
d.name,
MAX(s.user_seeks) AS UserSeeks,
MAX(s.user_scans) AS UserScans,
MAX(s.user_lookups) AS UserLookups,
MAX(s.user_updates) AS UserUpdates,
MAX(s.system_seeks) AS SystemSeeks,
MAX(s.system_scans) AS SystemScans,
MAX(s.system_lookups) AS SystemLookups,
MAX(s.system_updates) AS SystemUpdates
FROM sys.databases d
LEFT JOIN sys.dm_db_index_usage_stats s ON d.database_id = s.database_id
WHERE d.database_id NOT IN (1,2,3,4) -- Exclude system DBs: master, tempdb, model, msdb
GROUP BY d.database_id, d.name;
Why MAX? Each database can have multiple indexes. By taking the MAX of each counter across all indexes, you track the highest usage value seen for that DB. Even if only one table/index is used by user queries, you’ll catch it. Alternatively, you could store each index separately if you want to see usage at index level.
Step 4: Analyze Historical Snapshots to Identify Unused Databases
After collecting data for a sufficient period (a few weeks or a month, to catch infrequent usage), run queries against your IndexUsageStatsLog to see which databases never show any user-related activity.
SELECT
DatabaseID,
DatabaseName,
MIN(CaptureDate) AS FirstCapture,
MAX(CaptureDate) AS LastCapture,
MAX(UserSeeks) AS MaxUserSeeks,
MAX(UserScans) AS MaxUserScans,
MAX(UserLookups) AS MaxUserLookups,
MAX(UserUpdates) AS MaxUserUpdates
FROM DBAdmin.dbo.IndexUsageStatsLog
GROUP BY DatabaseID, DatabaseName
HAVING
MAX(UserSeeks) = 0 AND
MAX(UserScans) = 0 AND
MAX(UserLookups) = 0 AND
MAX(UserUpdates) = 0
ORDER BY DatabaseName;
• This pulls out any database where, across all snapshots you have, the user counters never rose above zero.
• Such a DB is likely only touched by system/maintenance processes (e.g., index rebuilds, DBCC, backups).
One CAVEAT with this script is that you may have to tweak it for your special needs. I explain the difficulties I had finding ANY databases that had not been accessed in the Testing section below.
Step 5: Validate & Decide on Next Steps
• Validate: Cross-check the “unused” list with known application owners or job schedules to confirm that no monthly/quarterly processes were missed.
• Action: Databases consistently showing zero user counters can be safely considered candidates for archiving or removal.
• Ongoing: Leave the snapshot job in place permanently (it’s light overhead) so you always have a historical usage record.
Advantages of This Method
1. Tracks SELECT Usage: Unlike transaction-based or file-size metrics, this approach captures read activity—both index scans and index seeks by user queries.
2. Distinguishes User vs. System: By looking at user_ counters, you filter out normal maintenance tasks that only bump system_ counters.
3. Minimal Overhead: Reading from sys.dm_db_index_usage_stats once a day or week is lightweight.
4. No Traces Needed: You don’t have to run Profiler or Extended Events.
5. Long-Term View: Storing the stats in your own table lets you see usage trends and survive restarts.
Final Notes
• Resets on Restart: Because the DMV in memory resets, it’s vital to persist the stats regularly.
• Rare Usage: If a database is used only once every few months, you might need to extend your observation window. Or check with the business to confirm no scheduled usage.
• Index Rebuilds: System usage (rebuild, reorg) increments system_*. That’s fine—user counters remain unaffected.
• Database backups also increment system_*. Again, user counters remain unaffected.
Testing the New Method
I put this method to the test and was surprised to find that I STILL couldn’t find any databases that had not been accessed. While there were many databases that showed zero seeks and zero updates, every database showed over a thousand scans.
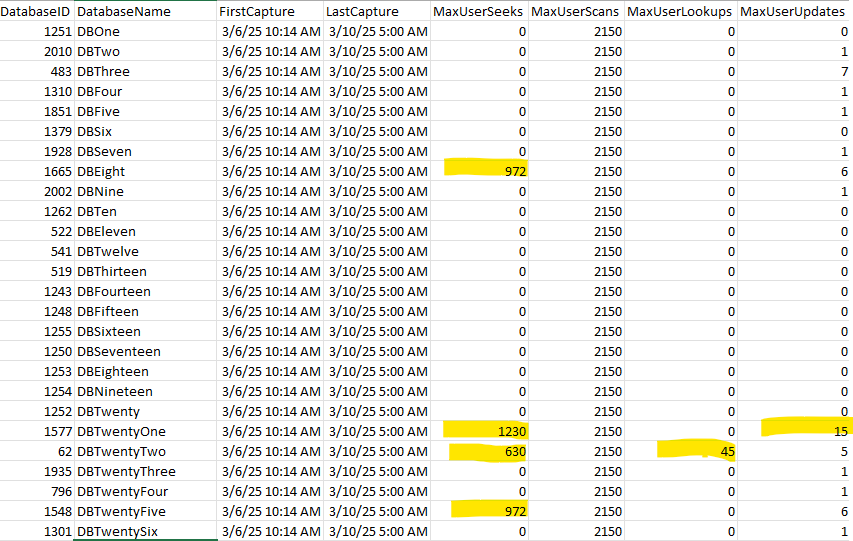
I noticed that many of the databases had the same seek, scan, and update count, so I wondered if there was a job that may be creating this anomaly. DBEight, DBTwentyOne, DBTwentyTwo and DBTwenySix definitely show recent activity, but all the rest need to be investigated further.
I looked at each job on the server and found a weekly job that gives a report of record counts for each table in each database. That means that the databases with the same seek, scan, update count may ALL be unused databases, but this job is showing user database access. This can be a great starting point. It narrows the list from thousands to hundreds of databases.
Final Conclusion
This was an interesting test learning how ChatGPT works. Also, I’m encouraged that it finally came up with a solution that works, but is not perfect. Every server will be different. This process may work perfectly on one server. However, all result sets will have to be analyzed carefully before actually removing any database that seems to be dormant.
I hope you got some ideas from this post.
For more information about blog posts, concepts and definitions, further explanations, or questions you may have…please contact us at SQLRx@sqlrx.com. We will be happy to help! Leave a comment and feel free to track back to us. Visit us at www.sqlrx.com!
Jeff Horner has been working in IT for 30+ years and has 26 years of SQL Server DBA experience. Jeff has worked in the transportation and distribution industry and is a super experienced DBA despite being the new guy. Jeff is located in Indiana and enjoys cooking and playing keyboard at his church.