Menu
Jobs on a SQL server can take milliseconds or minutes to complete depending on the size and complexity of your query and also the SQL environment on which it’s executing. It’s important to have a baseline or at least be familiar with the normal amount of time your SQL jobs take to execute. For a SQL job or script that is taking an excessive amount of time to execute, or one that is not completing at all you can troubleshoot in a few different ways by checking for blocking, deadlocking, wait types, hardware contention, missing indexes, bad query plans and a multitude of other things.
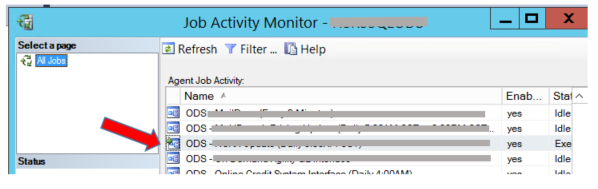
Recently we noticed a customer experiencing a very long running job on their system. From the Job Activity Monitor, we saw a job that normally takes seconds had been running for hours:
After confirming there was no blocking, we wanted to find out the wait type and the spid of the unresponsive and sluggish job by running this script:
SELECT sessions.session_id
,requests.status
,requests.blocking_session_id
,requests.wait_type
,requests.wait_time / (1000.0) 'wait_time(sec)'
,requests.cpu_time
,requests.total_elapsed_time / (1000.0) 'total_elapsed_time(Sec)'
,Substring(sqltext.TEXT, (requests.statement_start_offset / 2) + 1,
((CASE requests.statement_end_offset
  WHEN 1 THEN Datalength(sqltext.TEXT)
  ELSE requests.statement_end_offset
  END - requests.statement_start_offset  ) / 2
 ) + 1) AS statement_text
,requests.command
,databases.name as database_name
,sessions.login_name
,sessions.host_name
,sessions.program_name
FROM sys.dm_exec_sessions AS sessions
INNER JOIN sys.dm_exec_requests AS requests ON requests.session_id = sessions.session_id
CROSS APPLY sys.dm_exec_sql_text(requests.sql_handle) AS sqltext
INNER JOIN sys.databases AS databases on requests.database_id = databases.database_id
WHERE requests.session_id != @@SPID
ORDER BY requests.cpu_time DESC
*I can’t remember where I found this script. If this is familiar to anyone please send me a link so I can give proper credit
The results gave us some beneficial information in order to troubleshoot who was doing what on the system, and what type of waits were happening for the spid involved in the long running job. The results showed SLEEP_TASK as the wait type for the long running query:

Ordinarily SLEEP_TASK is a nonspecific wait type in SQL Server which occurs when a task sleeps while waiting for a generic event to occur, according to Microsoft documentation. This wait type can usually be safely ignored, however on some occasions it can happen when a script does not execute completely or hangs up for long periods of time.
The SLEEP_TASK wait means that a thread is waiting on a resource or waiting for some event to occur, and could indicate background task scheduling, a query plan exchange operator that isn’t tracked by CXPACKET, or it could be a hashing operation that spills to tempdb.
Hash spills mean there is not enough memory to execute the query, and data has to be spilled into tempdb in order to execute. This usually results in slower performance and space consumption in tempdb. In order to determine if hash spills are occurring, you can run SQL Profiler and enable Hash Warning Events. For more information on that click here https://docs.microsoft.com/en-us/sql/relational-databases/event-classes/hash-warning-event-class.
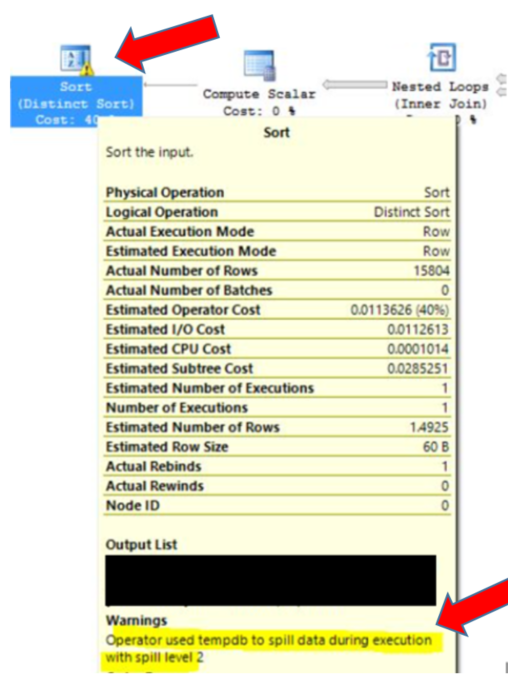
The best way to identify hash spills is to check execution plans in any suspected stored procedures or queries. You will find them in execution plans by looking for the SORT operator with a yellow warning sign on it. If you hover over the operator, you will see the warning message highlighted in yellow:
In the event it is a hash spill, the recommendation is to create and/or update statistics on the database being used. This is the most effective way to reduce hash recursions or bailouts if statistics are needed in a query using join or aggregate operations.
If hashing events are occurring, it’s a good idea to update statistics:
--Method 1 – Update Statistics on specific tables
USE YourDatabase
GO
UPDATE STATISTICS dbo.SalesOrderDetail

-- Method 2 – Update Statistics on the whole database
USE YourDatabase
GO
EXEC sp_updatestats
Normally if you update statistics, plans will recompile when they are used next. If you find that the plan is still hash spilling, it might be because the plan is trivial and not a candidate to be recompiled. You may be forced to clean out the cache or force a recompile in some way. Here are the ways to do that in increasing order of magnitude.
-- recompiles a specific object
EXEC sp_recompile N'BadProc'

-- clear out plan cache for a specific database
DBCC FLUSHPROCINDB(YourDatabaseID)

-- clear all execution plans out of cache
DBCC FREEPROCCACHE

-- clear out all plan caches for the instance (This is the big one!) try to not use this in production
-- only use this if all others fail
-- can cause slowdowns while all plans for all queries are recreated
DBCC FREESYSTEMCACHE('ALL')
Once the plan has recompiled with fresh stats you should see the hash spill go away.
Conclusion
SLEEP_TYPE wait types are normally ignored and very nonspecific. Occasionally however it can indicate hash spills, among other things. Hash spills are possible to correct, so this should be investigated in the event you experience a long running query along with the SLEEP_TASK wait type.
For more information about blog posts, concepts and definitions, further explanations, or questions you may have…please contact us at SQLRx@sqlrx.com. We will be happy to help! Leave a comment and feel free to track back to us. Visit us at www.sqlrx.com!
Session expired
Please log in again. The login page will open in a new tab. After logging in you can close it and return to this page.
[…] Ginger Keys gives an example where the SLEEP_TASK wait indicates a performance problem: […]