–by Ginger Keys
Have you ever watched performance metrics in Performance Monitor (Perfmon) and wondered which SQL Server activities were causing those spikes? SQLRx offers a Microsoft Partner-of-the-Year award-winning service that will correlate all performance metrics on your server with very little overhead, and will pinpoint with precision, right down to a line of code or even a network switch, what is bottlenecking your system. A real live person will then document and advise you exactly how to remedy the problem, and will walk you through each step.
However if you don’t need a comprehensive analysis, and simply want to find what TSQL statements are causing performance spikes, or if you want to observe a single TSQL statement and how it affects server resources, this can be done using SQL Profiler in conjunction with Performance Monitor (Perfmon). Both Profiler and Perfmon provide good information about your server, but being able to correlate these together will help to find the causes of performance spikes.
SQL Profiler will soon be deprecated, but will be available for a while longer. The specific version of SQL has not been determined yet. Profiler is being replaced with Extended Events, and currently there is no straightforward way to use extended events to correlate performance spikes with Perfmon.
In order to correlate performance metrics with SQL activities, we will follow these steps:
*Warning: This article is intended to show you how to use the tools…it is highly advised not to do this on your production server.
Create Profiler Trace
Open SQL Server Management Studio (SSMS) and connect to your instance. On the menu bar, go to Tools, and click on SQL Server Profiler to get started. SQL Profiler will put stress on your server, so focus only on the events and columns needed to analyze the activities, so to minimize the workload on your server.
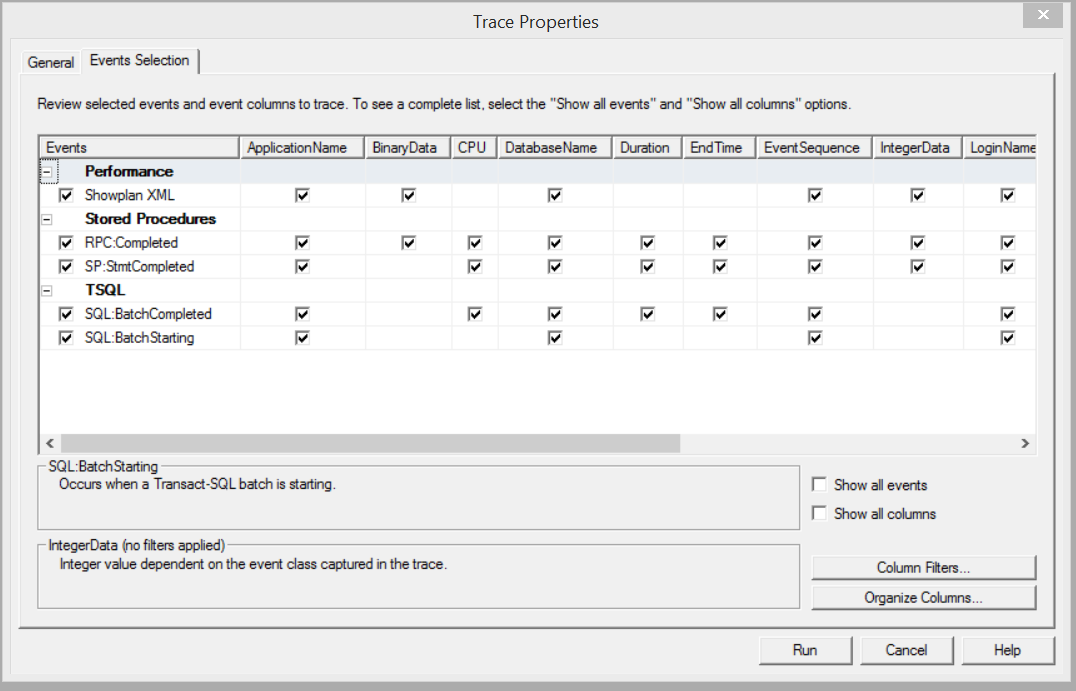
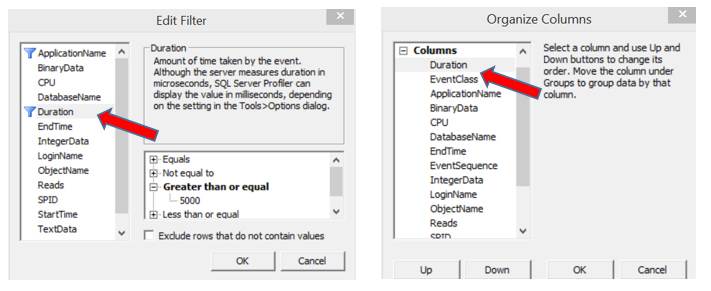
We want to capture TSQL statements that might be causing performance spikes, so we will look at stored procedures, batches of queries, and individual queries. We will then filter the trace for statements that take longer than a certain Duration (ex. 5000 milliseconds), to filter out the normal running statements.
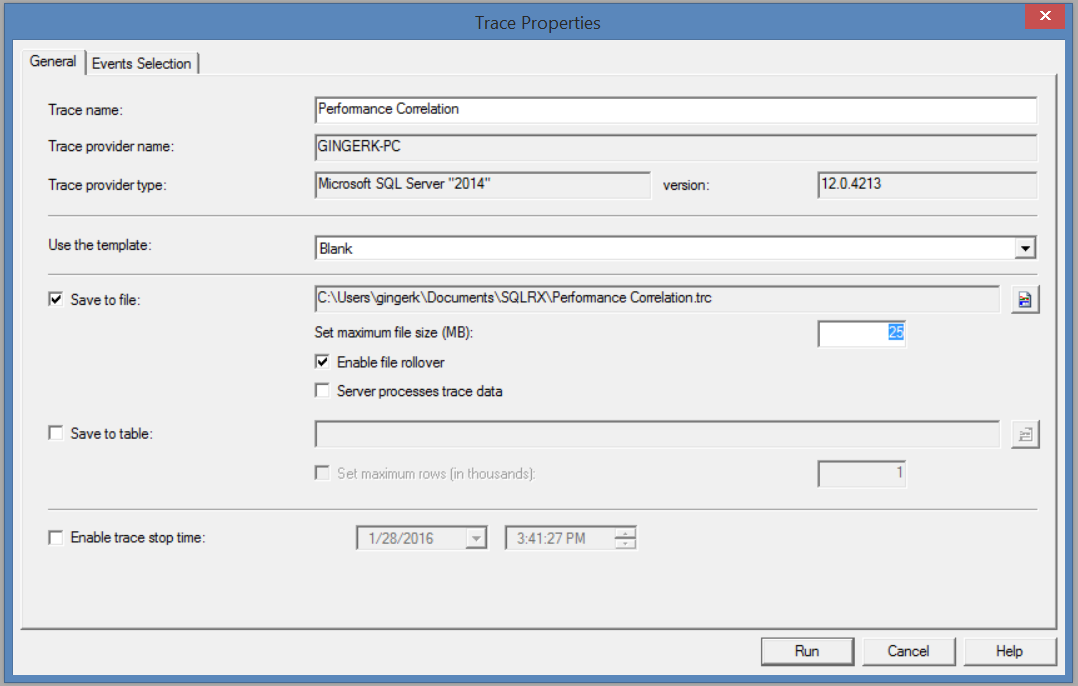
In the example below, I will use a Blank template, specify the events and columns needed, and save the results to file. Make sure you have enough space on your disk to hold the collected data.
Go to the Events Selection tab, and select these Events:
And include these Columns
|
|
Then create a Filter on
Create Perfmon Data Collector Set
While the SQL Profiler is collecting TSQL statements that are executing, we want to also collect data on several performance metrics on the system. From Administrative Tools, open Performance Monitor (Perfmon). Drill down to Data Collector Sets > User Defined. Right click and select New Data Collector Set.
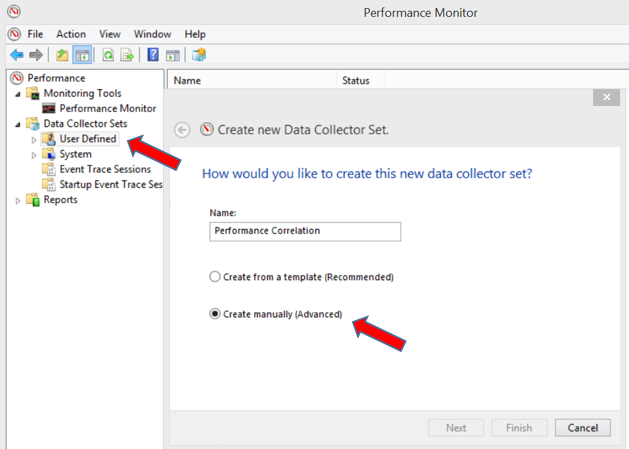
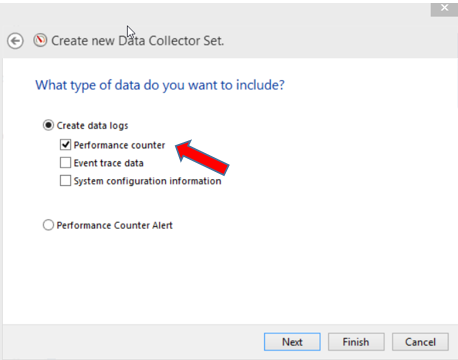
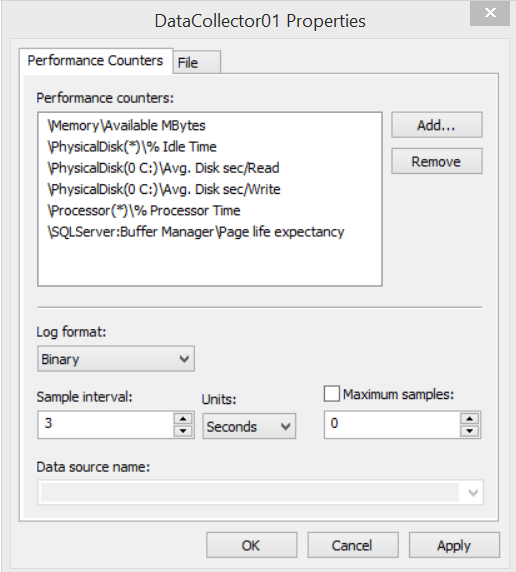
Add the following Counters:
You can add as many performance metrics as you deem necessary to view your environment, but these are some basic memory, disk, and CPU metrics.
Set the Sample interval time to 3 seconds, to average out and not collect 1 second spikes. Save your output to a file on your disk with enough space to hold the data collected.
Simulate High CPU Usage
A few pointers before you begin…start SQL Profiler and Perfmon, making sure to start and stop both about the same time. If you are able to run these on a computer other than the server you are monitoring, that is preferred. If not, just be mindful that Profiler creates its own performance stress, so don’t do this if your system is in a critical state. Whatever you do, DO NOT DO THIS ON A PRODUCTION SYSTEM!!
If you already have specific times of the day when you know your server’s resources are peaking, run these tools during that time. Be sure to monitor the size of the data files output so that you don’t consume too much space on your drive.
If you already have some queries you want to test against the performance of your system, you can start and stop the tools during the time you are testing your queries.
If you want to artificially stress resources on your system for practice purposes, there are many TSQL statements available online to stress CPU and memory. Here are a few statements you can run to stress CPU:
— Query to Keep CPU Busy for 30 Seconds
DECLARE @T DATETIME, @F BIGINT;
SET @T = GETDATE();
WHILE DATEADD(SECOND,30,@T)>GETDATE()
SET @F=POWER(2,30);
— Query to Keep CPU Busy for 60 Seconds
DECLARE @T DATETIME, @F BIGINT;
SET @T = GETDATE();
WHILE DATEADD(SECOND,60,@T)>GETDATE()
SET @F=POWER(2,30);
— Query to stress CPU
SELECT SUM(CONVERT(BIGINT, o1.object_id)
+ CONVERT(BIGINT, o2.object_id)
+ CONVERT(BIGINT, o3.object_id)
+ CONVERT(BIGINT, o4.object_id))
FROM sys.objects o1
CROSS JOIN sys.objects o2
CROSS JOIN sys.objects o3
CROSS JOIN sys.objects o4
— Another Query to stress CPU
SELECT * INTO #columns
FROM sys.columns AS C
DECLARE @RCNT INT
SET @RCNT = 0
SET NOCOUNT ON;
WHILE @RCNT = 0
BEGIN
UPDATE #columns
SET column_id = 0
WHERE ISNUMERIC(CONVERT(FLOAT, CONVERT(NVARCHAR(20), CONVERT(VARCHAR(20), column_id)))) = 0
SELECT @RCNT = @@ROWCOUNT
END
— And another Query to stress CPU using Adventureworks database
USE AdventureWorks2014
GO
DECLARE @Flag INT
SET @Flag = 1
WHILE(@Flag < 1000)
BEGIN
ALTER INDEX [PK_SalesOrderDetail_SalesOrderID_SalesOrderDetailID]
ON [Sales].[SalesOrderDetail] REBUILD
SET @Flag = @Flag + 1
END
GO
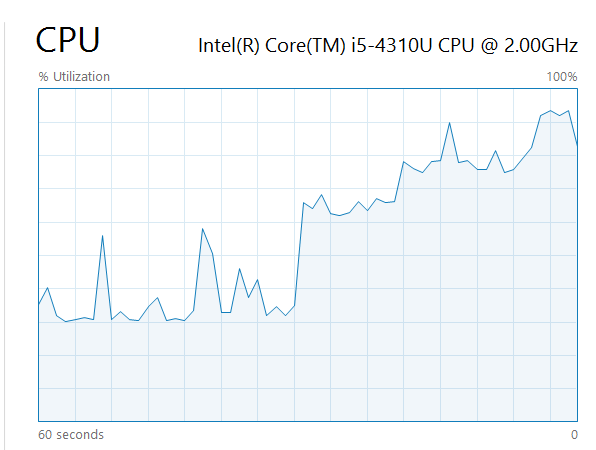
I started the SQL Profiler trace and also the Perfmon data collector. Then after executing the above queries, we can see by looking at Task Manager that the CPU has spiked from 30% range up to 85% range.
Analyze and Correlate the Results
In order to analyze the results, both sets of data (the profiler trace and the Perfmon collection) need to be uploaded into SQL profiler:
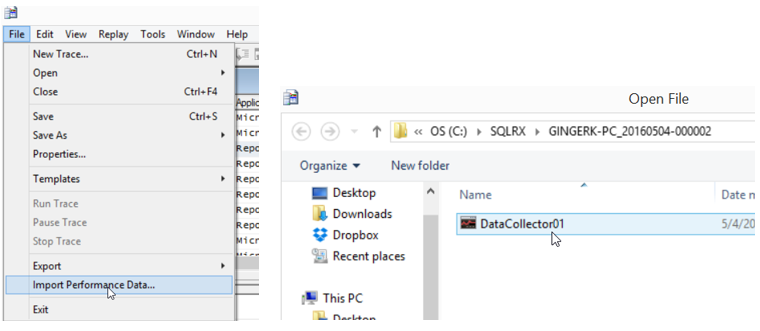
Open the Profiler Trace (trc) file from where the output was saved.
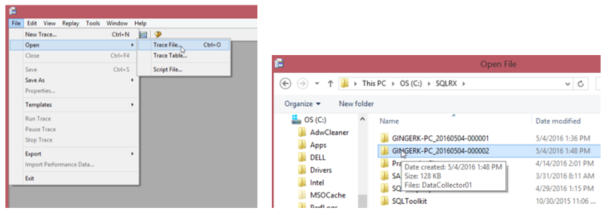
Then click on File > Import Performance Data > and select the Perfmon file saved.
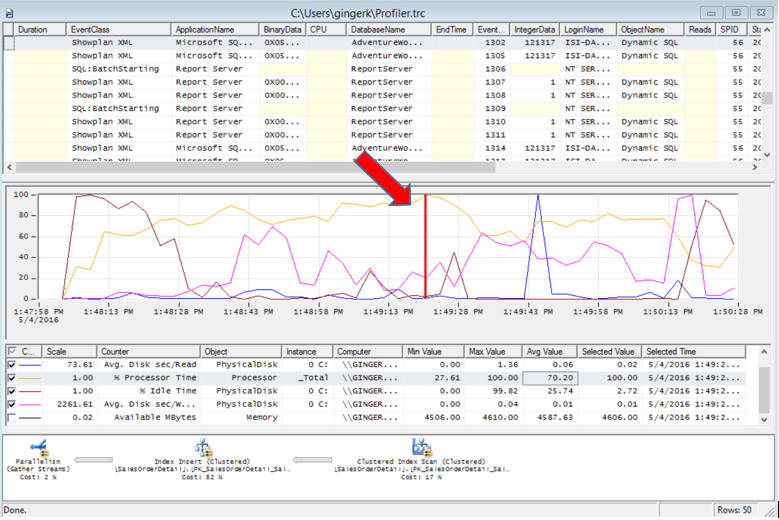
The results below show all TSQL statements run during the time period, along with the Perfmon graph and numerical values. The top section shows the profiler events in the order in which they occurred. The middle section shows the Perfmon graph for the duration of the collection period with the min, max, and average values. The bottom section displays either the text of the SQL statement or an execution plan.
You want to look for spikes or bottlenecks in the performance metrics, and then identify the profiler events that occurred around that time.
Click anywhere on the Perfmon graph and the TSQL statement will be pulled up in the Profiler event list. If I click on the Perfmon graph where I see the CPU was 100% (vertical red line below), the chart takes me to the general location (time period) in the Profiler events. You will need to scroll up or down in the list of events during that time period to find the actual event that caused the CPU spike. Clicking on the CPU spike in the Perfmon graph takes us to a TSQL statement around the time frame of that spike and provides the execution plan as shown below:
You can also click on a line in the Profiler events to see where the performance counters were at that time in the Perfmon graph (indicated with a red line below). I have clicked on a high CPU duration in the TSQL statement list where SQL: BatchCompleted occurred, and the Perfmon metrics on the graph shows 89% processor time and 2% disk idle (which means the disk was 98% busy).
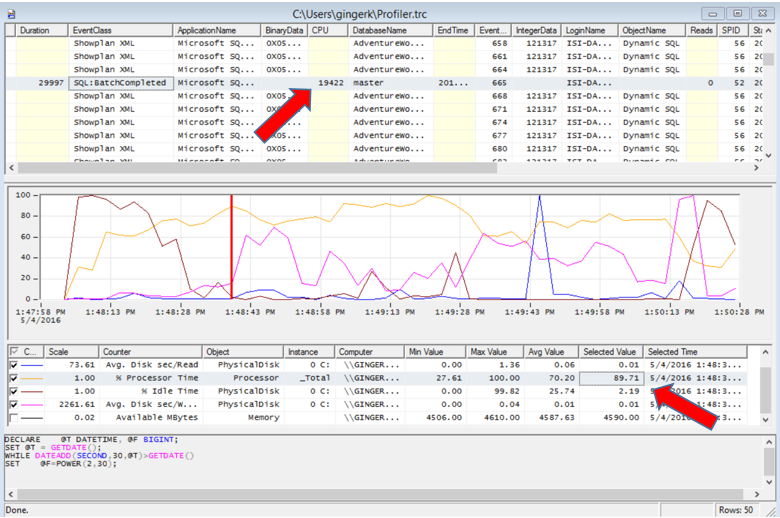
In our example, the memory performance metrics were not substantial, but the CPU and disks were being stressed, with the average value for CPU being around 70%, and the average disk idle time at 25% (which means it was 75% busy).

Beware of some ‘Gotchas’!
Don’t run Profiler in production environment! Profiler causes much stress on a system, so if you have access to another server from which you can run this tool, it is preferred. If you don’t have another server to run Profiler from, take great care not to do this during critical periods on your production machine, and be sure to set filters so you don’t collect everything that is running.
Clicking on Perfmon spike will only take you to general area in the list of Trace events. As shown in the example above, you might or might not be directed to the exact Profiler event that caused the spike in performance. You will need to look around in the general area of that time period in the Trace to find the exact event that caused the spike.
There could be non-SQL processes causing your performance issues. If there are other non-SQL applications running on your production server that are causing performance stress, you won’t see those events by using the SQL Profiler tool.
There could be multiple processes happening causing Performance spikes that don’t exceed your Duration filter. Individually these (low to medium resource users) aren’t a problem, but collectively they can cause problems if they are occurring simultaneously. If there are lots of smaller resource users that don’t meet your filter, you won’t see them, but together they could be causing performance issues.
Catching Showplan XML will catch everything happening in SQL because it doesn’t have a Duration column to filter on…which will bloat your trace file. Again, it is better to run these tools on a server apart from your production server.
* Disclaimer: Our SQLRx performance analysis process vanquishes all these ‘gotchas’…just sayin…give us a call
Conclusion
Being able to correlate TSQL statements with performance metrics can help you determine why you are seeing stress on your system, it can pinpoint queries that may need tuning, and it can help you observe how your queries will affect the performance of your hardware and resource usage. This can be done during a period of spikes in performance, especially if you know beforehand when these spikes occur. However keep in mind that running SQL Profiler contributes to the stress on your system, so take care not to do this during a critical performance spike, and as mentioned before it is most ideal to do this from a non-production server.
This article describes the general methods for using the SQL Profiler tool in conjunction with the Windows Performance Monitor. Correlating performance issues with this process is not 100% accurate, but will give you a great starting point to investigate performance stress on your system. Finding performance bottlenecks and knowing how to correct them is an in-depth process that usually requires years of experience. If you need guidance or assistance with this, contact us. We are experts in this, we have over 40 years of experience, and have helped over 700 clients. We can help you!
If you would like assistance configuring, maintaining, or monitoring your SQL Server and instances please contact us at SQLRx@sqlrx.com. We would be happy to answer any question you have, and would be interested to hear about your SQL experiences as well! Visit us at www.sqlrx.com.