Menu
Rx for Demystifying Index Tuning Decisions – Part 2
By Jeffry Schwartz | Expert
In Part 1 of this blog series the author discussed various aspects of SQL Server indices such as:
https://blog.sqlrx.com/2017/10/26/rx-for-demystifying-index-tuning-decisions-part-1/
Part 2 covers the following topics:
It is simple in a test or development environment using a significant subset of production data to obtain an actual (and useful) query plan of a troublesome query. Business transactions often require many queries to complete so determining which ones are the most troublesome can be difficult. The author has observed countless customers who were certain they knew exactly where the performance problems were only to find out the problems were elsewhere. Therefore, collecting the appropriate performance data on a production server is critical in determining the queries that need tuning most. Examples of query performance criteria are listed below:
Table 1 shows examples of queries that potentially need tuning based upon the number of executions, total reads, total duration, total CPU time, and average reads per execution. This kind of report immediately focuses attention on the queries that might benefit the most from either index or query tuning. The five queries highlighted in Table 1 underscore these criteria. The ones highlighted in yellow were the worst offenders because their executions collectively performed the most reads with the worst one totaling 3.5 BILLION reads. The ones highlighted in light green and orange accounted for the most CPU time as well as the longest total duration. The one highlighted in slate ran the most times, and the ones highlighted in gray performed the most reads per execution. This information is vital when determining where query and index tuning should be focused. Table 2 provides additional information in that it shows whether the large numbers of reads were consistent regardless of the specified input parameters or if they were parameter-dependent. For example, the 80th percentile of the third query was 453,515, which means that 80 percent of the queries performed 453,515 reads or fewer. The 100th percentile represents the maximum of 1.724 billion reads and tells the analyst that 20 percent of the queries performed at least 453,515 reads. This data informs the analyst that the specific parameters of the execution that performed 1.724 billion reads should be used for tuning. The read behavior of the last two queries, highlighted in light green and light orange, indicates that the choice of parameters does not make any notable difference in execution behavior. The query highlighted in light blue exhibits similar performance. This kind of information is invaluable because the author has observed too many tuning efforts on development or test machines that could not reproduce the performance of the query in the production environment. Sometimes, this results from a dramatic difference in the sizes of the respective databases, but other times it results from an inappropriate choice of parameters.

Table 1: Summary Query Metrics Example
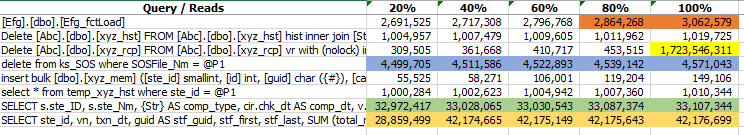
Table 2: Query Reads Distribution Example
Extended Events are very useful for capturing comprehensive workload performance information because they are lightweight and can be tailored to capture only the most important information. They were introduced in SQL Server 2008, but didn’t mature until SQL Server 2012. A full treatment of how to capture important query performance data using XEvents is beyond scope of this blog series. However, further information can be viewed at https://blog.sqlrx.com/2016/01/28/sql-server-20122014-extended-events-for-developers-part-1. XEvents use the concept of a session that must be configured, started, and stopped to capture data. This can be accomplished using SSMS or T-SQL. The basic steps involved with capturing and reporting XEvents data are listed below:
An example of some T-SQL session specification code is shown in Figure 1. Important note: The Duration filter is in MICROSECONDS. Use the following T-SQL command to start the session: ALTER EVENT SESSION WorstQueries ON SERVER STATE = START and this command to stop the session: ALTER EVENT SESSION WorstQueries ON SERVER STATE = STOP. Once the session has been stopped, open WorstQueries.xel using SSMS or use T-SQL to report or load the data into a database table. Note: XEL files can be viewed in real-time, if necessary. Figure 2 displays a completed statement sample viewed via SSMS.
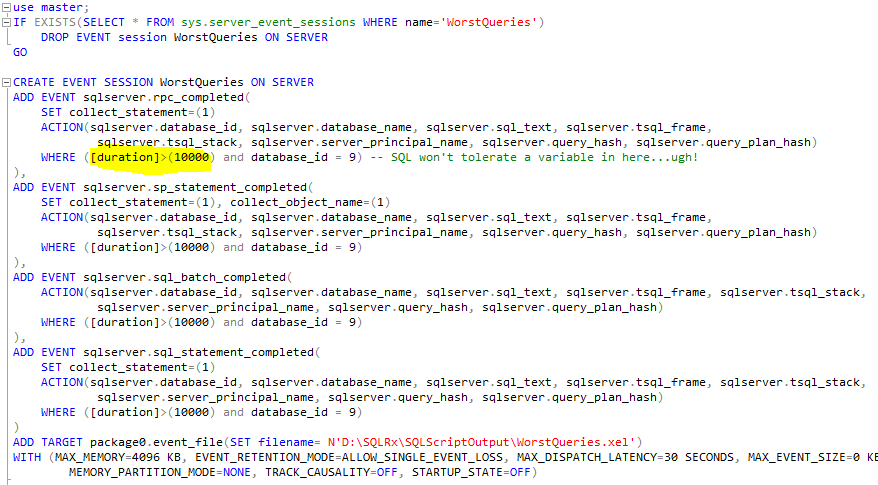
Figure 1: Code that Creates WorstQueries Session
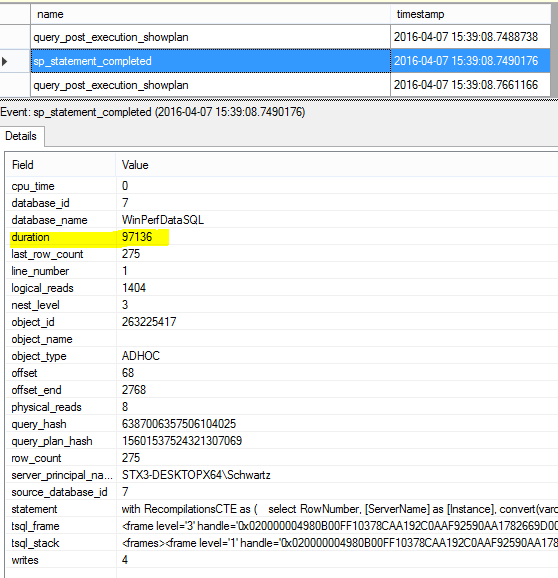
Figure 2: XEvents Statement Completed Sample Output
The next article in this blog series will cover query/execution plans. The fun stuff is coming up!! Until then….happy tuning and please let us know if you have any questions.
For more information about blog posts, concepts and definitions, further explanations, or questions you may have…please contact us at SQLRx@sqlrx.com. We will be happy to help! Leave a comment and feel free to track back to us. Visit us at www.sqlrx.com!
Session expired
Please log in again. The login page will open in a new tab. After logging in you can close it and return to this page.
[…] Jeff Schwartz continues his series on index tuning: […]
[…] https://blog.sqlrx.com/2017/11/02/rx-for-demystifying-index-tuning-decisions-part-2/ […]
[…] https://blog.sqlrx.com/2017/11/02/rx-for-demystifying-index-tuning-decisions-part-2/ […]
[…] https://blog.sqlrx.com/2017/11/02/rx-for-demystifying-index-tuning-decisions-part-2/ […]
[…] https://blog.sqlrx.com/2017/11/02/rx-for-demystifying-index-tuning-decisions-part-2/ […]