Adding a Missing Index Killed Performance
By Jeffry Schwartz | Indexes
Recently, a customer requested that we tune a query that took 13 seconds to return 11 rows. SQL Server 2017 suggested an index to improve performance, so we added it in a development environment. The improvement made the query run 647 seconds, almost 50 TIMES longer than the original! This naturally caused much consternation, so we decided to determine what and why it happened as well as how we could still achieve the original objective, i.e., make the query run faster. This article discusses what caused the original performance problem in addition to the new one that was caused by the introduction of an index, and illustrates how we were able to make the query run significantly faster than it did originally. We will cover reading query plans, examining the specific details of query plan operators, the effects of index statistics on missing index recommendations, using query plan XML to enable simpler query plan comparison, and the effects of using functions in where clauses.
All tests were performed on SQL Server 2017 with 32 GB of RAM. All pertinent caches were cleared prior to each query test discussed in this document to ensure that cached data and query plans did not skew the results. In addition, actual query plans are shown instead of estimated ones. Performance data and actual query plans were captured using Extended Events (XEvents). More information about capturing and examining this information can be found at the following link: https://www.sqlrx.com/sql-server-20122014-extended-events-for-developers-part-1/.
Note: Although it is possible to compare query plans using SSMS, we wanted to determine more specifically and visibly how metrics like elapsed time, CPU time, logical reads, rows read, and readaheads changed as we tried several different statistical update and index options. We felt that using these metrics would give us a much more quantifiable means for comparison, especially since we had so many tests and plans to consider. In addition, although statistics IO and time can be used within SSMS to provide these metrics, XEvents provided a simpler and less manual means by which we could obtain these measurements. It also enabled us to be more certain about associating execution metrics with the proper query plans. Therefore, we employed a combination of XEvents and extracted query plan XML to provide the necessary information.
We used SentryOne Plan Explorer to display the query plans shown in this document.
The query, shown below in Figure 1, originally was contained within a stored procedure whose end date parameter, @I_EndDt, was passed in. We chose to isolate the query in its own script and use a local variable to eliminate any parameter or stored procedure-related issues. Therefore, @I_EndDt was assigned a constant value for this research. The query uses two detail tables to create a location list. The record counts of the tables used by the query are as follows:

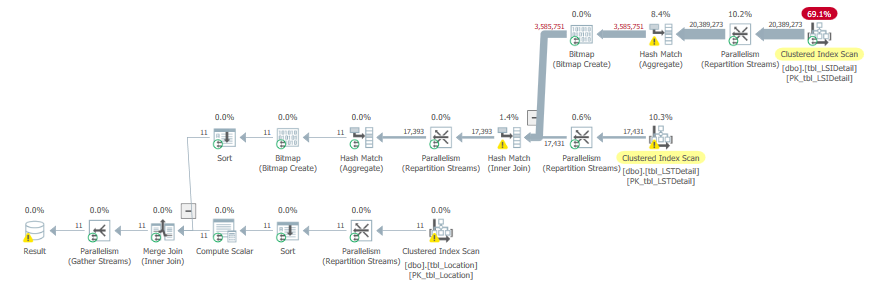
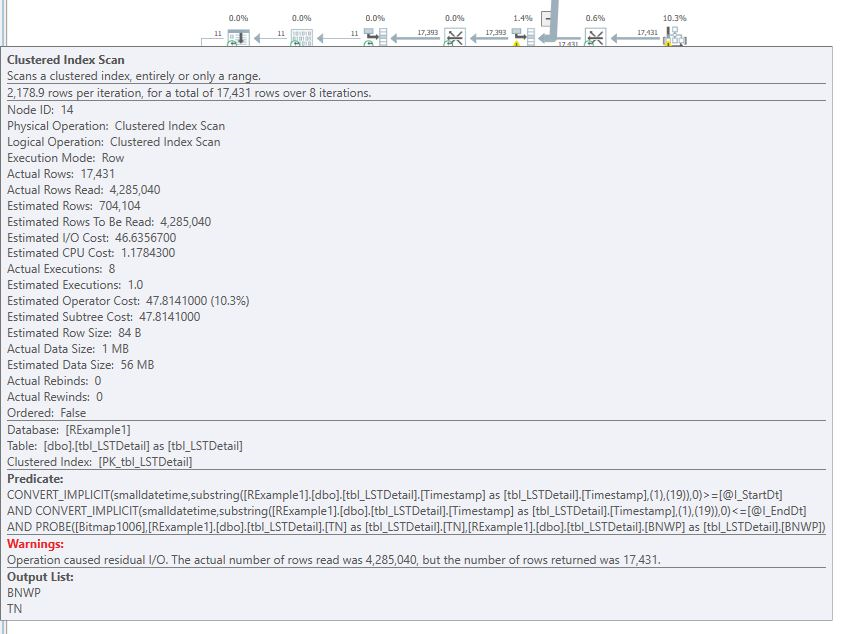
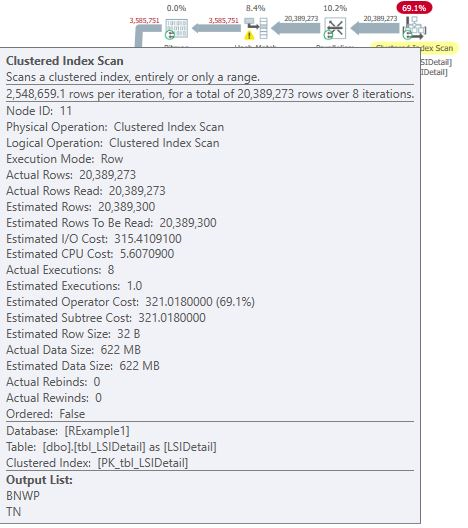
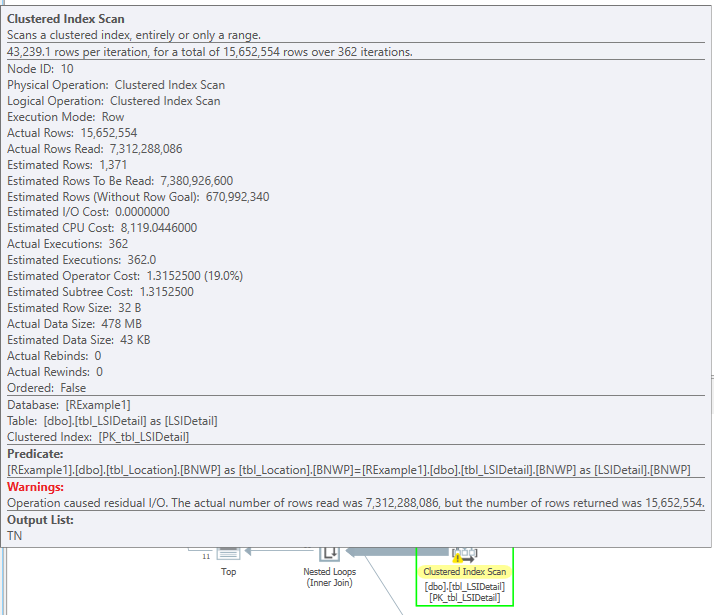
As shown in Table 1, none of the columns used in the where or join clauses of this query were referenced in any of the indices. The query plan, shown in Figure 2, highlights two clustered index scans, which is not surprising considering the obvious lack of index support. Figure 3 and Figure 4, obtained by hovering the mouse over the clustered index operators, illustrate the specifics of each scan. Note the warnings shown in Figure 3 and parallel operator icons that are visible in the query plan.
Figure 5 highlights the QueryTimeStats and MemotryGrantInfo nodes of the XML plan for the query in Figure 1. The query plan XML can be obtained easily by right clicking on a query plan in SSMS and selecting the Show Execution Plan XML… option. This will open a new window in SSMS and display the entire query plan XML tree. The QueryTimeStats node provides the elapsed and CPU times (in milliseconds) for the entire query and is particularly useful when examining the RunTimeInformation node for each thread in a parallel plan because the sums of the individual actual elapsed and CPU times may exceed the actual times. The MemotryGrantInfo node contains information regarding several memory usage metrics, but the two that are most valuable for our purposes are GrantedMemory and MaxUsedMemory. The first one tells us how much memory SQL Server allowed the query to use (in KB) and the second one reports the maximum amount of memory that the query actually used. The MaxUsedMemory metric will be quite useful when comparing the plans from a memory consumption perspective. In Figure 5, we can see that the query was granted approximately 112,000 KB of memory and used approximately 97,000 KB. These values will become important as we examine future tests.
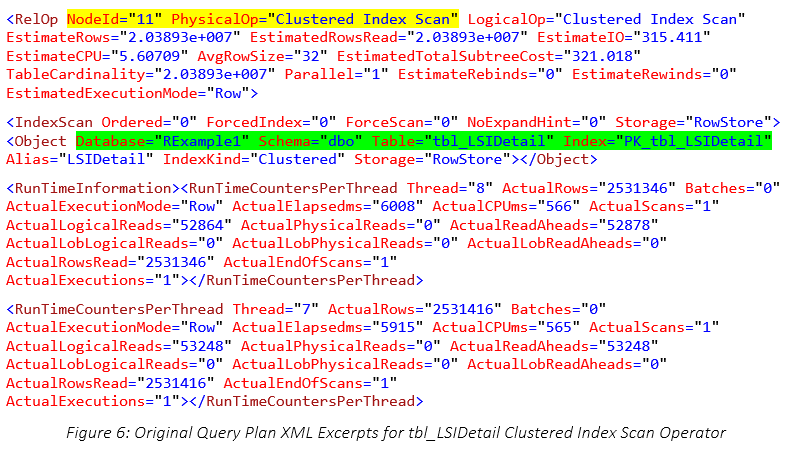
Figure 6 shows the RelOp node, which provides many pieces of information. The first two are attributes: NodeId and PhysicalOp. Please note that NodeId identifies the operator uniquely within a plan and that the NodeId in Figure 6 matches that shown in Figure 4. This identifies the operator and indicates that both figures refer to the same operator in the query plan. PhysicalOp describes the operator, which in this case, is a clustered index scan. Two child nodes, IndexScan and RunTimeInformation, tell us more about the specific operator. The IndexScan node is useful for determining the table and index names that were used for the scan operator. This is critical for comparisons with other plans because we needed to determine how the two tables in question were used as changes were made. The RunTimeInformation node reports what each execution thread did. For parallelized plans, some of these values had to be summed to obtain totals. Only one thread was used for non-parallelized plans. Figure 6 shows the execution information for two threads, 7 and 8, which is yet another indicator that this plan was parallelized. Although the specifics of each XML plan are not shown in this document, these excerpts should provide enough understanding regarding how the metrics that will be discussed in this document were obtained.
As shown in Figure 5, the original query using the original index structure was executed and ran for approximately 13 seconds. The performance metrics of the operators which accessed the important tables are summarized in Table 2. The highlighted values in the last row of the table illustrate how the sum of the elapsed and CPU times for the threads can exceed the actual times recorded both in the query plan and in the captured XEvent completion records. Since the query total times are of most concern, these times will be used for comparison with other executions. One useful indicator of overall work performed is the Actual Rows Read metric. As shown in Table 2, the total was approximately 24.7 million. The Logical Reads metric, which was approximately 491,000, is also useful.
declare  @I_StartDt smalldatetime
declare  @I_EndDt smalldatetime = '02-14-2019'

select @I_StartDt = dateadd(day,-6,@I_EndDt)

select tbl_Location.ID,
 tbl_Location.BNumber + ' - ' + tbl_Location.BName,
 tbl_Location.BNWP
 from
 tbl_LSIDetail tbl_LSIDetail WITH (NOLOCK)
 inner join tbl_LSTDetail  tbl_LSTDetail WITH (NOLOCK) on
tbl_LSTDetail.TN = tbl_LSIDetail.TN
 Inner join tbl_Location tbl_Location WITH (NOLOCK) on
tbl_Location.BNWP = tbl_LSIDetail.BNWP and
 tbl_Location.BNWP = tbl_LSTDetail.BNWP
where left(tbl_LSTDetail.Timestamp,19) >= @I_StartDt and
left(tbl_LSTDetail.Timestamp,19) <= @I_EndDt
Group by tbl_Location.ID,
 tbl_Location.BNumber + ' - ' + tbl_Location.BName,
 tbl_Location.BNWP
Figure 1: Original Query Code


Prior to SQL Server 2014, missing index recommendations were seldom, if ever, made to address full scans. However, since we were running under SQL Server 2017 and the database compatibility level was set to 140, SQL Server recommended that an index, displayed in Figure 7, be added to tbl_LSTDetail.
/*
Missing Index Details from C:UsersSchwartzAppDataLocalTemp…
The Query Processor estimates that implementing the following index could improve the query cost by 12.2815%.
*/
CREATE NONCLUSTERED INDEX <Name of Missing Index, sysname,>
ON dbo.tbl_LSTDetail (TN,BNWP)
INCLUDE (Timestamp)
Figure 7: Original Query Missing First Index Recommendation
Although the impact estimate was only 12, we decided to implement it anyway to see if it would help. After the recommended index was implemented in a development environment, the query was executed again. It eventually finished after running for 647 seconds! After verifying that the recommendation had been implemented properly (see Table 3), an actual query plan, shown in Figure 8, was obtained. The query plans are quite dissimilar with the following differences being most pronounced:

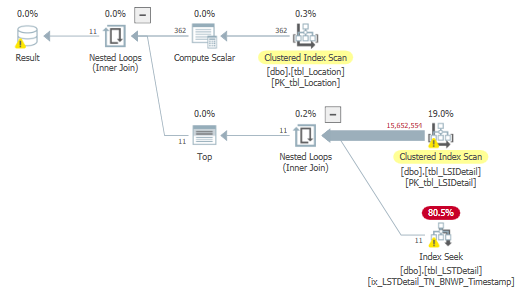
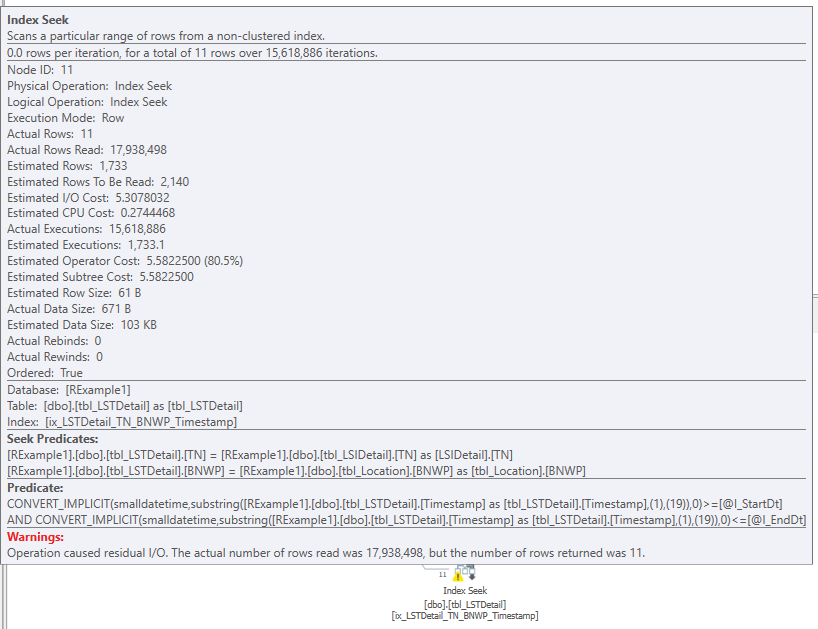


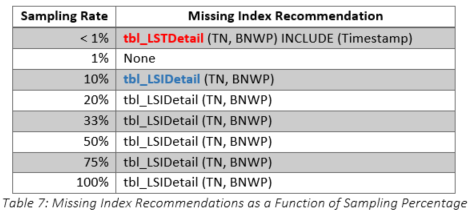
Clearly, the recommended index was a terrible idea, so we dropped it and tried to determine why SQL Server had provided such a recommendation. Although we thought that the index statistics on various columns in the tables were up-to-date, we decided to check them for ourselves. They were last updated at 05:01:06 on 2019-07-19, which was shortly before the customer requested query tuning. We decided to take things one step further and determine exactly what the sampling rate had been when the statistics were updated. The results are shown in Table 6. It is obvious that the sample rate was very low, especially for tbl_LSIDetail (highlighted), so we decided to recreate the statistics using a new sampling rate. The original query was rerun with the original index structure and SQL Server generated a new recommendation, which is shown in Figure 11. Not surprisingly, the recommended index was entirely different after the statistical changes. Having observed the changes in the recommendations, we decided to determine at what points the sampling rates made a difference in the index recommendations. The results are shown in Table 7 and it is important to note the table change from tbl_LSTDetail to tbl_LSIDetail when the sample rate was greater than one percent. Additional tests were performed and these showed that the sampling rate of tbl_LSIDetail made the real difference.

/*
Missing Index Details from C:UsersSchwartzAppDataLocalTemp…
The Query Processor estimates that implementing the following index could improve the query cost by 88.774%.
*/
CREATE NONCLUSTERED INDEX <Name of Missing Index, sysname,>
ON dbo.tbl_LSIDetail (TN,BNWP)
Figure 11: Missing Index Recommendation after Statistics were Recreated with a Higher Sampling Rate
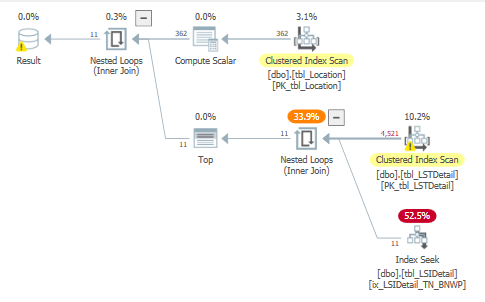
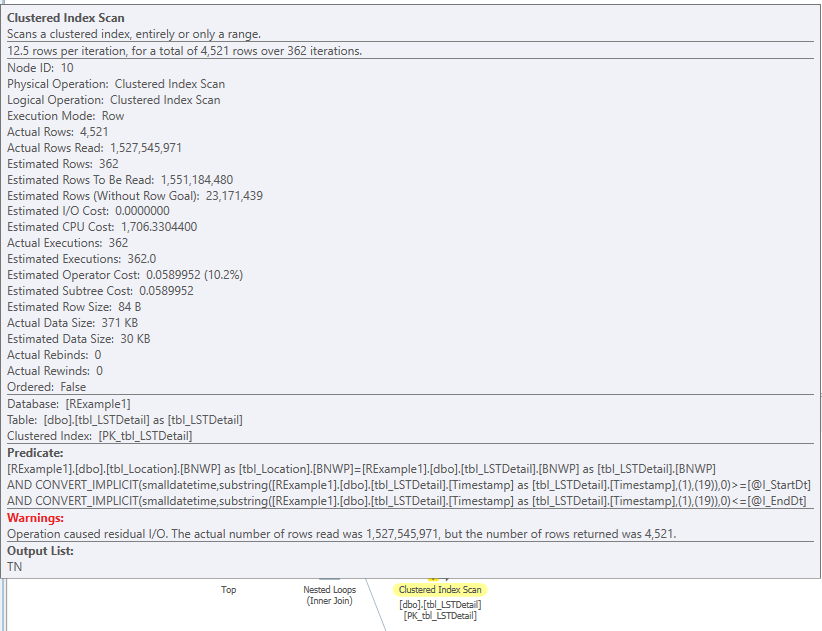
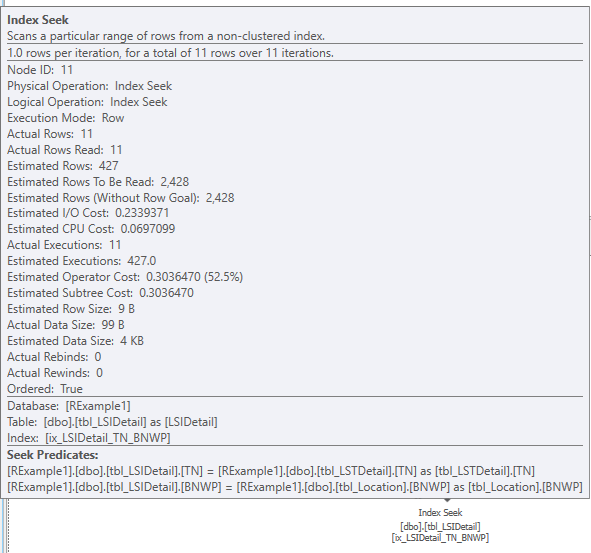
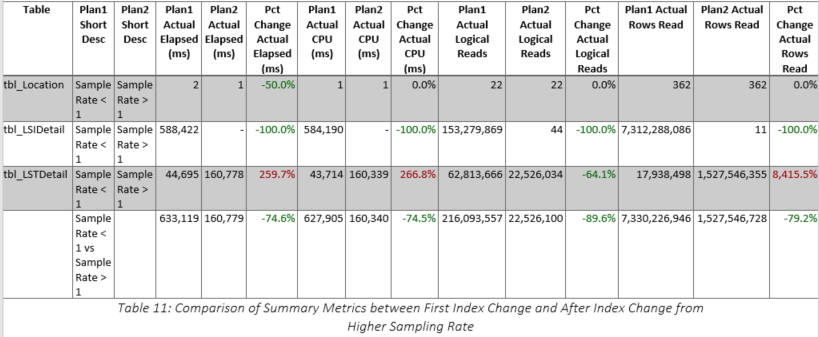
The recommended index was implemented (as shown in Table 8) and the query improved to 161 seconds, 75 percent reduction from 647, but still 12 times longer than the original run time. The actual query plan is shown in Figure 12, and the specifics for the two main operators are shown in Figure 13 and Figure 14. Clearly, the tbl_LSIDetail portion of the plan improved substantially, and even the tbl_LSTDetail portion improved, especially in terms of the number of actual rows read. Overall, as shown in Table 9, the number of actual rows read decreased from 7.3 BILLION to 1.5 BILLION. Table 10 shows that although many of the metrics were better than the first index test, they are still far too high to be of real value because the elapsed time of this query was still 1,156 percent higher than the original. The specific comparison of the first and second index tests is shown in Table 11. The usage of tbl_LSIDetail dropped to almost nothing, but tbl_LSTDetail’s usage increased 8,416 percent! The net result was a 75 percent reduction in elapsed time, but as cited previously, we still are not close to the original time. Query memory consumption continued to decrease, dropping from 704 KB to 24 KB.


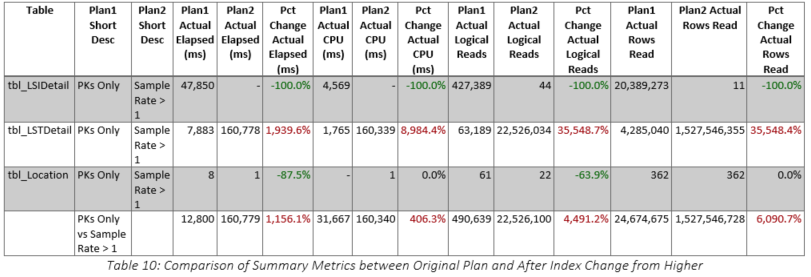
Thus far, we have implemented two indices recommended by SQL Server and neither has accomplished our mission of improving upon the original run time of approximately 13 seconds. The two indices have yielded elapsed times of 646 and 161 seconds, respectively, nowhere near the 13 seconds we achieved without any additional indices. Analyzing the query shown in Figure 1, it is clear that the Timestamp column in tbl_LSTDetail is a varchar or nvarchar column. Further examination revealed that it is an nvarchar column that contained a fully specified date and time followed by a dash and a two-digit number. The value of this two-digit number ranged from 4 to 8. However, since the code makes no use of anything except the date (the 19 characters includes the date and time with their normal delimiters), it seemed that something should be done to limit the number of records processed in tbl_LSTDetail because as shown in Table 10, the majority of the second index query’s work was done against the tbl_LSTDetail table. This hypothesis was further reinforced by the fact that although the number of records in total was 4.3 million, the number of records in the specified date range was only 17,430.
Since the second index recommended by SQL Server seemed to reduce the amount of work against tbl_LSIDetail, we decided to retain this index and try to aid the query in its search for tbl_LSTDetail records within a certain date range. However, we did not want to force any application code to change, so we decided to implement an index that used the Timestamp column in an index, as well as TN as a secondary key. We included the BNWP column to give the query the best possible chance of running well. The definition that we used in shown in Figure 15.
CREATE NONCLUSTERED INDEX ix_LSTDetail_TS_TN_BNWP ON tbl_LSTDetail
(
	[timestamp],
	TN ASC
)
include
(
	BNWP
)
WITH (PAD_INDEX = OFF, SORT_IN_TEMPDB = OFF, DROP_EXISTING = OFF, IGNORE_DUP_KEY = OFF, ONLINE = OFF)
ON [PRIMARY]
Figure 15: New tbl_LSTDetail Index that Used Timestamp as the First Key
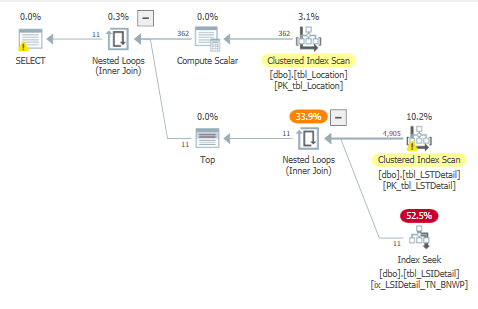
We did not think this index would help performance because the query used the left function on the Timestamp column (see Figure 1) and these kinds of constructs usually cause SQL Server to ignore an index that uses that column as the first key. This is, in fact, what happened. We won’t show the timings here because they were about the same as those of the last test. Figure 16 shows why – the new index is nowhere to be seen in the query plan! We mainly included this test in this article to emphasize the importance of not using function calls in where clauses whenever possible.
To test the concept of incorporating the Timestamp into the index structure properly, we created a computed column that generated a persisted datetime from the nvarchar Timestamp string. The resulting column definition of timestampDT is shown in Figure 17. This column is persisted because we needed to use it in an index whose definition is shown in Figure 18. Fortunately, every record contained a timestamp that was valid once the last three characters were removed. In summary, we used the index from the second recommendation and added our own that used the computed column as shown in Table 12.
[timestampDT] AS (CONVERT([smalldatetime],left([timestamp],(19)),(101))) PERSISTED NOT NULL
Figure 17: Computed Column Definition to Create a DateTime Data Type Column from an Nvarchar Column
CREATE NONCLUSTERED INDEX ix_LSTDetail_TSDT_TN_BNWP ON tbl_LSTDetail
(
 [timestampDT],
 TN ASC
)
include
(
 BNWP
)
WITH (PAD_INDEX = OFF, SORT_IN_TEMPDB = OFF, DROP_EXISTING = OFF, IGNORE_DUP_KEY = OFF, ONLINE = OFF) ON [PRIMARY]

CREATE NONCLUSTERED INDEX ix_LSIDetail_TN_BNWP ON tbl_LSIDetail
(
 TN ASC,
 BNWP
)
WITH (PAD_INDEX = OFF, SORT_IN_TEMPDB = OFF, DROP_EXISTING = OFF, IGNORE_DUP_KEY = OFF, ONLINE = OFF) ON [PRIMARY]
Figure 18: tbl_LSTDetail Index that Used the Persisted DateTime Column

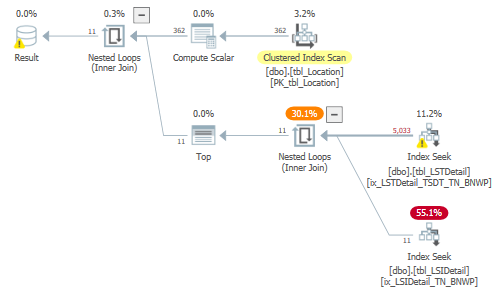
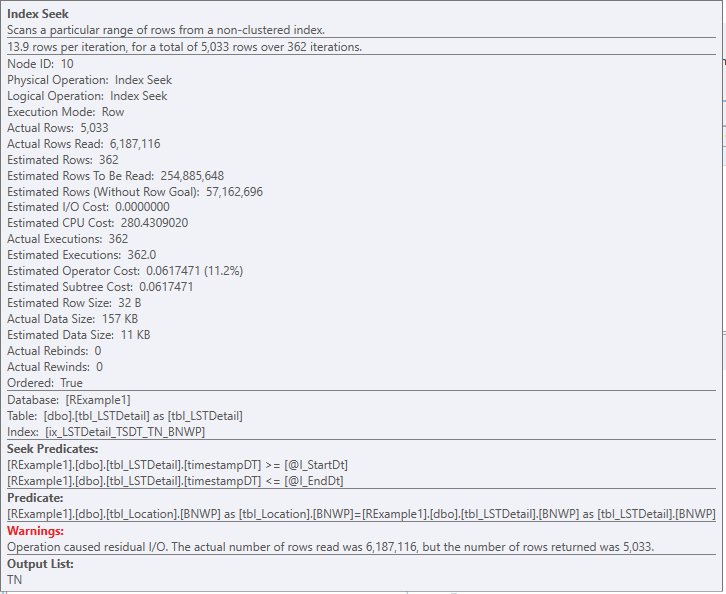
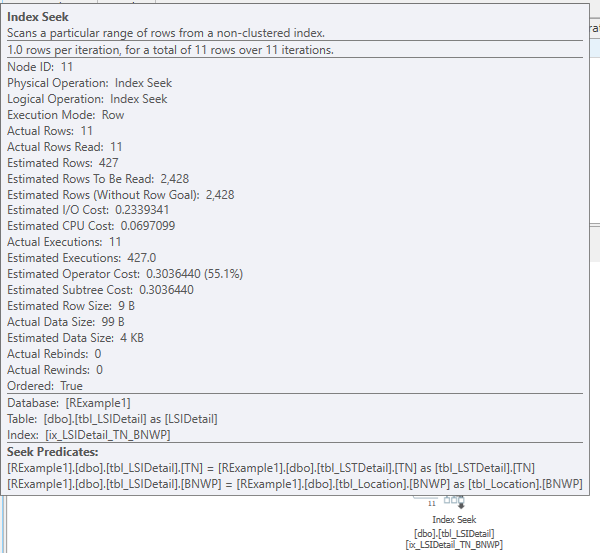
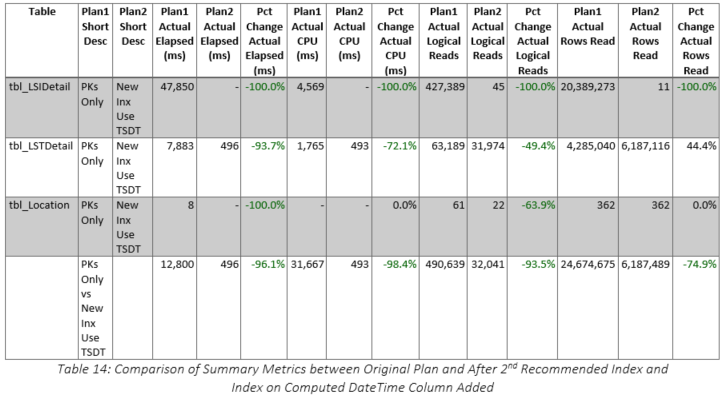
The query plan is shown in Figure 19 and all the scans against the large tables have been converted to seeks. Interestingly, the seek against tbl_LSTDetail generated a warning as shown in Figure 20, but the seek against tbl_LSIDetail accounted for 55 percent of the elapsed time. As shown in Table 13, the run time was less than half a second! The comparison with the original version of the query using the original index structure is shown in Table 14 and the improvements are obvious. A summary of the reductions is listed below:

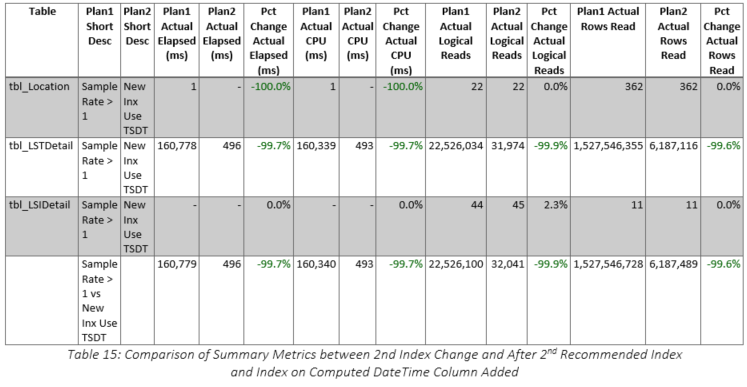
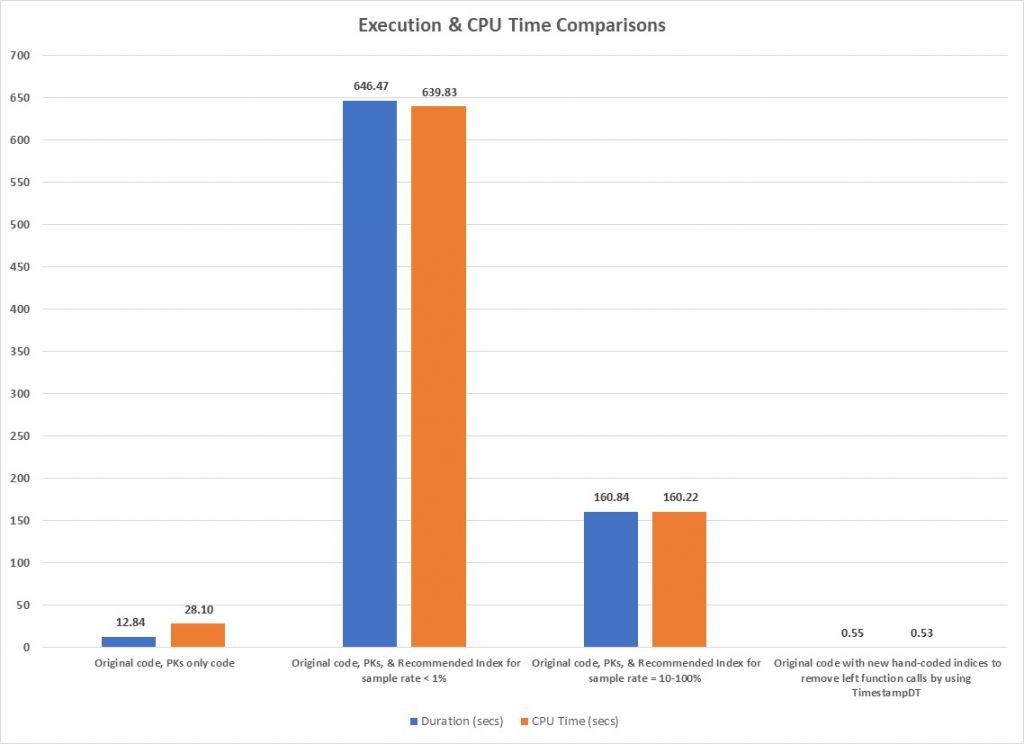
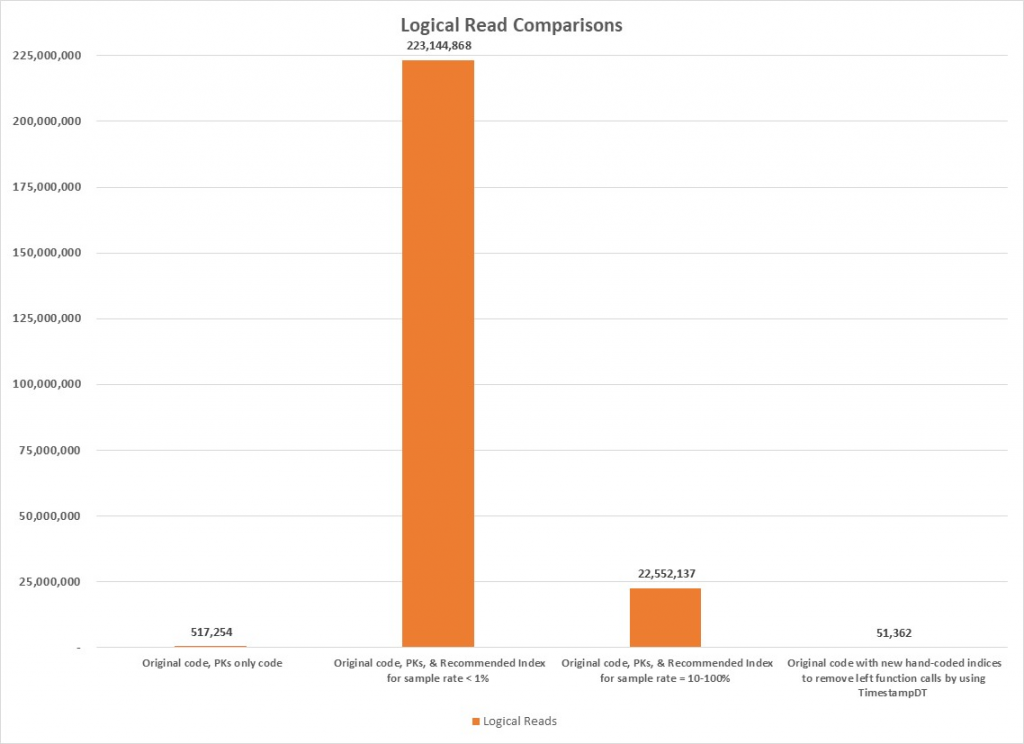
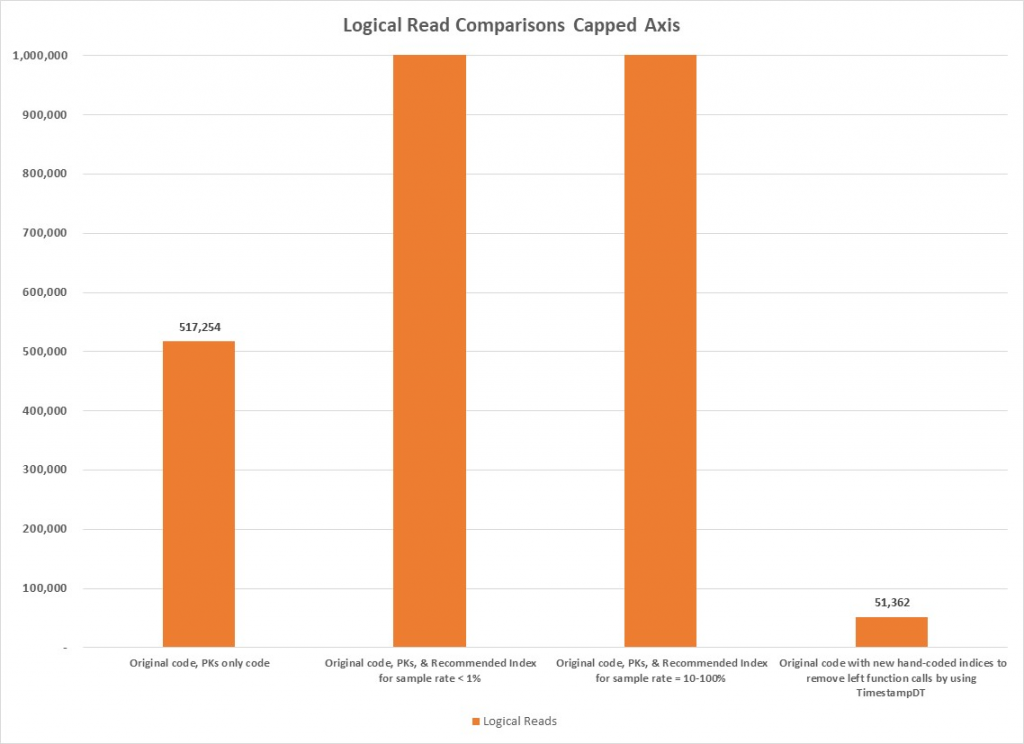
Previously, individual results were cited, but it is useful to also review the various test results together to gain an overall perspective. Results of the major tests that were discussed previously are summarized in Table 16 and graphed in Figure 22 through Figure 24. Clearly, the results of the second test are the most prominent because the values of the metrics are so large, but the last test also is noteworthy because its values are so small. Figure 24 is provided to provide a better comparison of the logical read metrics that would otherwise have been obscured by the size of the second test’s values.

In summary, several lessons were learned or reinforced during the course of this project and they are enumerated below:
For more information about blog posts, concepts and definitions, further explanations, or questions you may have…please contact us at SQLRx@sqlrx.com. We will be happy to help! Leave a comment and feel free to track back to us. Visit us at www.sqlrx.com!